
Comparing your variables.
Raven’s Eye easily and efficiently lets you make comparisons of patterns in your data, which we call geists. One way of doing this is by selecting the Variables button in the menu bar.
When you click on the Variables button to select it, a dropdown box appears. In this box are folder icons representing each column that you previously classified as a variable. Clicking on the + icon next to the folder will reveal the differing states or classes of variables that were present in the data comprising that column. Clicking on the - icon next to the folder will collapse the folder.
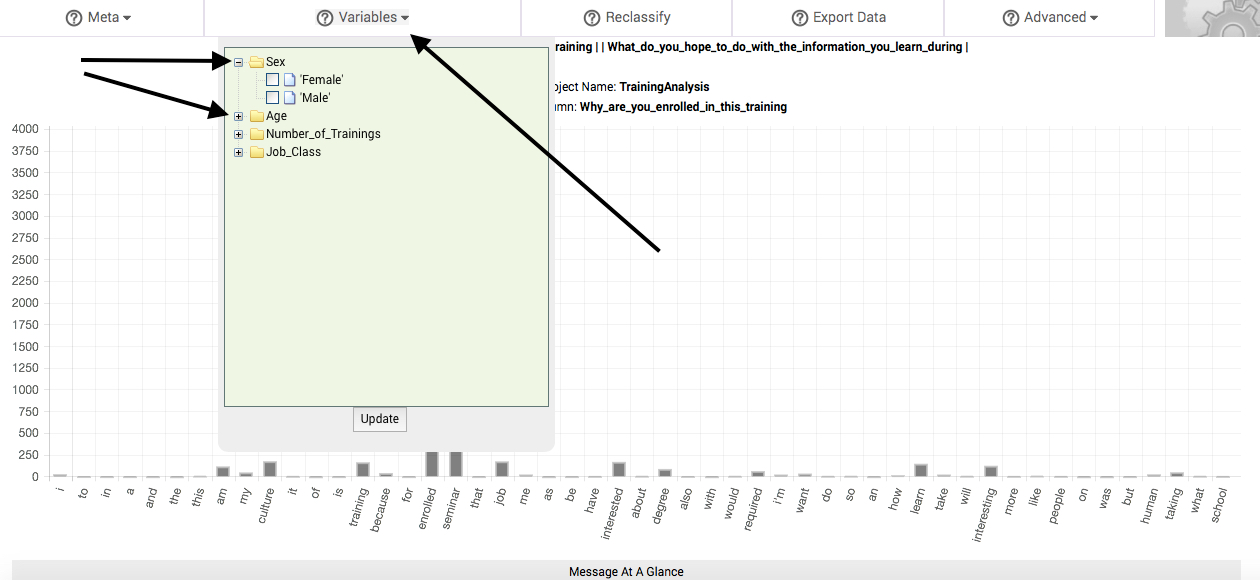

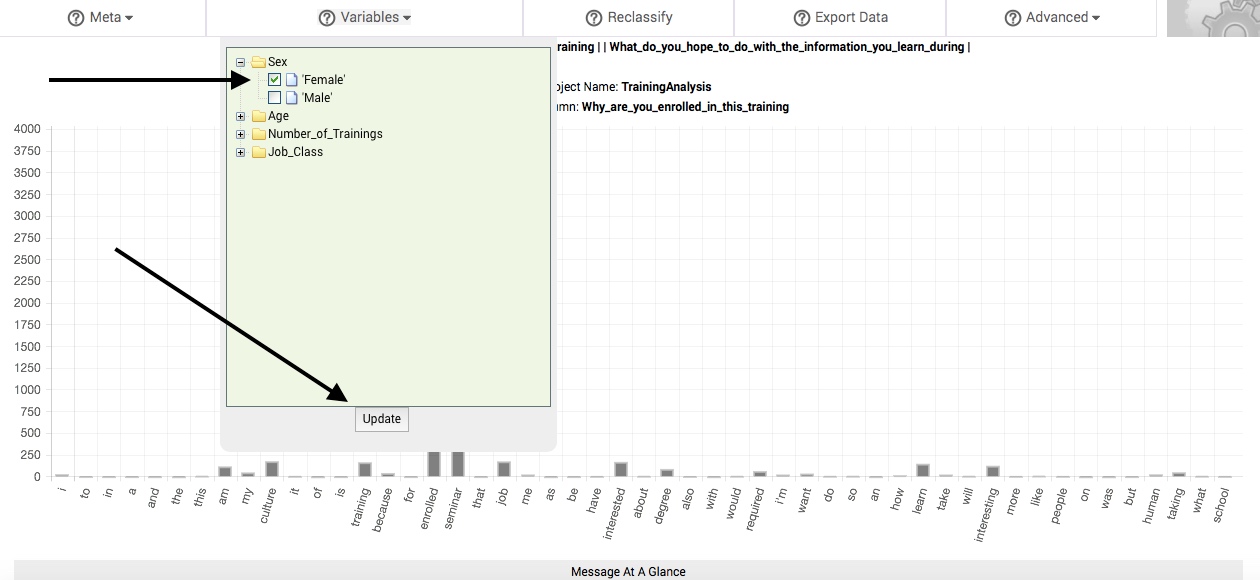
To compare the change in response patterns associated with these differing states or classes of variables, select one or more or more of them by clicking in the adjacent box (a checkmark will appear in the box). Then, click the Update button, located at the bottom of the Variables dropdown box. In a matter of seconds, a new table of results will replace the main table. We call this table the subbsample comparisons table, and it is described in the following section.

Every time you select a state or class of a particular variable, that state or class is treated as a subsample of your larger sample. All of the responses associated with this state or class are pooled together and compared to the pooled responses associated with every other non-selected state or class of the particular variable. If you select more than one state or class of a variable, the selected states and classes will be pooled together to form your subsample, while the remaining non-selected states or classes will be pooled together to form the comparison pool.
If you select specific states or classes in more than one variable, then the responses from those cases that match the state or class of each and every selected variable independently will be pooled together as your subsample. This is helpful for distinguishing patterns associated with the presence of multiple variables, such as response patterns associated with multiple experimental conditions, or those who meet multiple demographic characteristics.
You can remove your selections at any time by clicking each checkmarked box again (the checkmark will disappear when you do so), and then clicking the Update button, located at the bottom of the Variables dropdown box.
If you leave your project or sign out of Raven’s Eye with variables selected, their selection will be retained in your project the next time you access it. If you would like to restart your analyses anew, please remember to either remove your selections before leaving your project, remove them after reopening your project, or upload your data anew.
Subsample comparisons table.
If you have selected a specific variable value to compare to another (such as men compared to women, or one participant compared to the rest), your results are displayed in a table containing 8 columns. This new table is comprised of all five columns from the main table, plus three additional columns. The three new columns appear interspersed between the five previously described columns of the main table.
The subsample comparisons table will, by default, arrange data according to the proportion of the subsample that each word comprises. Columns can be re-sorted by clicking on the title of the column.
The first column is entitled Word. This column lists each and every word in your data set. It is the same as the first column in the main table, though it now prioritizes by each word’s proportion in the subsample (the fourth column).
The second column, # Subsample, identifies the number of times that each specific word is found in your subsample.
The third column, # Sample, identifies the number of times that each specific word is found in the remainder of the sample not included in your subsample. It is calculated the same way as the second column in the main table.
The fourth column, % Subsample, identifies the proportion of the subsample accounted for by each and every word in the subsample (converted to percent). By default, this column orders all of the data presented in the table. It is arranged in descending order.

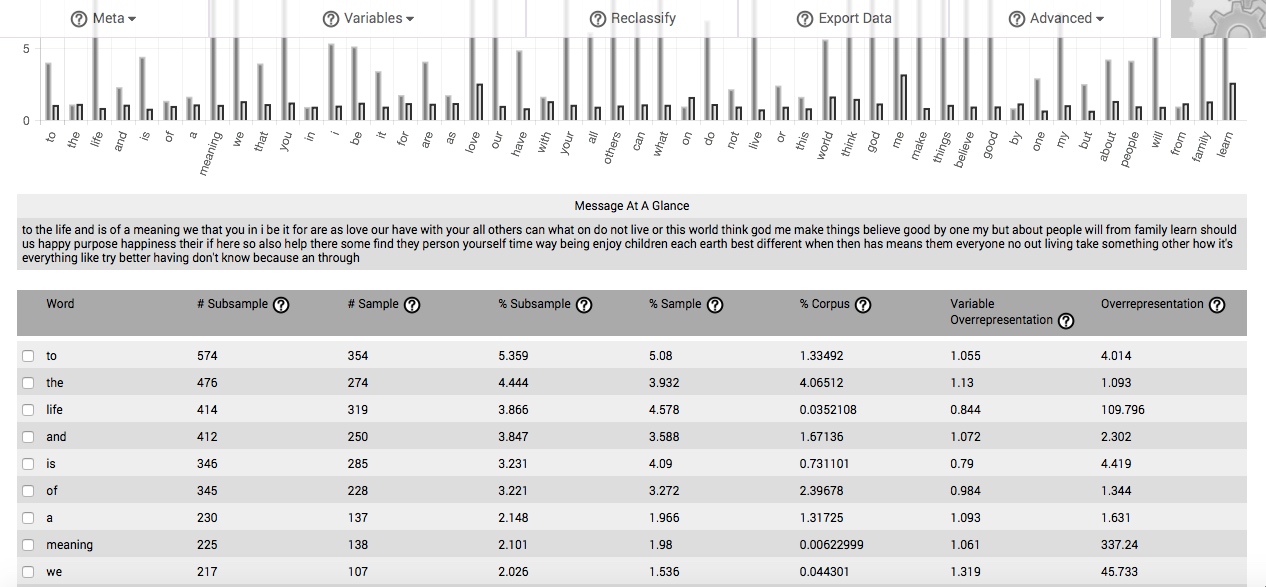
The fifth column, % Sample, identifies the proportion of the non-selected portion of your sample accounted for by each and every word used used in it (converted to percent). It is calculated same as the third column in the main table.
The sixth column, % Corpus, identifies the proportion of the comparison corpus accounted for by each and every word in the subsample (converted to percent). It is calculated the same way as the fourth column in the main table.
The seventh column, Variable Overrepresentation, is the quotient of the fourth column (% Subsample) divided by the fifth column (% Sample), and represents the degree to which each given word is overrepresented in your subsample, based on the proportion of that given word in the remainder of your sample. As the value in this column approaches “1.0,” the more the word is used in the subsample at the same rate that it is found in the remainder of the sample, and is not then particularly associated with this state or class of your variable. The more the value exceeds “1.0,” in this column, the relatively more overrepresented the word is in your subsample. Given adequate sample size and representativeness, high degrees of overrepresentation indicate that a word is highly associated with some aspect of the state or class of the variable you have selected to define your subsample, as compared to the rest of your sample.
The eighth column, Overrepresentation, is the quotient of the fourth column (% Subsample) divided by the sixth column (% Corpus), and represents the degree to which each given word is overrepresented in your subsample, based on the proportion of that given word in the comparison corpus. As the value in this column approaches “1.0,” the more the word is used in the subsample at the same rate that it is found in the corpus, and is not then particularly associated with this state or class of your variable. The more the value exceeds “1.0,” in this column, the relatively more overrepresented the word is in your subsample. Given adequate sample size and representativeness, high degrees of overrepresentation indicate that a word is highly associated with some aspect of the state or class of the variable you have selected to define your subsample, as compared to the background corpus.
As discussed in Understanding your results, the numbers found in the Variable Overrepresentation and Overrepresentation columns also serve as estimations of confidence. While Overrepresentation continues to refer to the relative proportionality of the word in the subsample compared to its proportionality in the background corpus, Variable Overrepresentation instead compares the subsample proportionality of the word to its proportionality in the remaining portion of the sample.
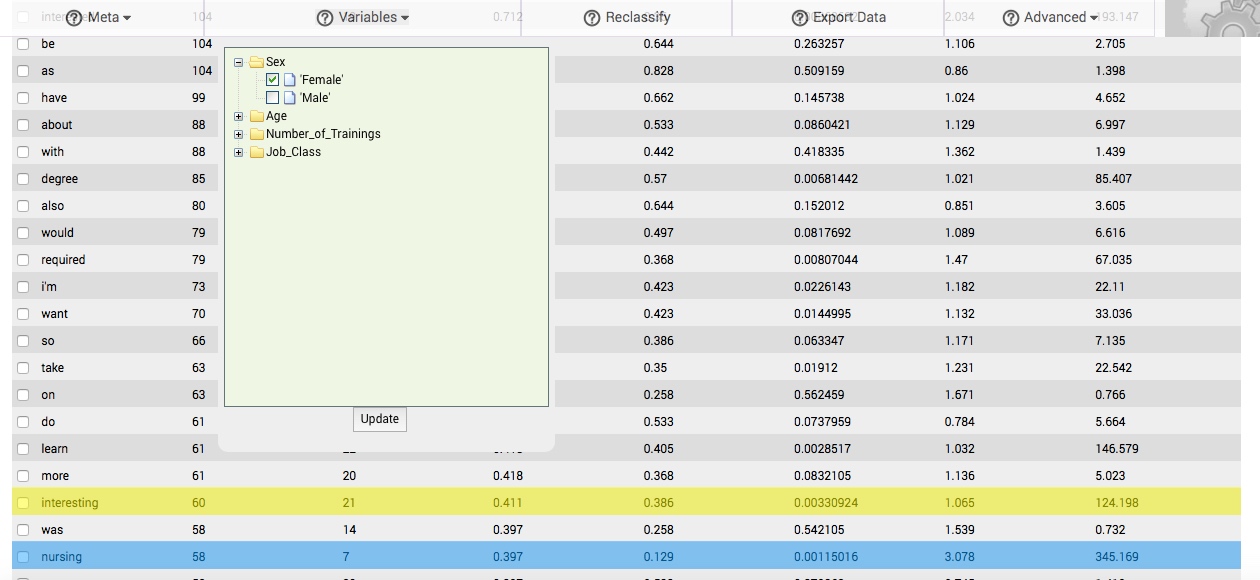
In the table to the right, which is drawn from responses to a question asked of participants in a culture training1, females mentioned nursing (highlighted in blue) at a proportionality exceeding 3 times the rate that males used the word, and 345 times the word's proportionality in the background comparison corpus. Nursing would then be associated with responses to the question generally, and more particularly with females who respond to the question.
The same table reveals that the word interesting is also associated with responses to the question, being found at a proportionality that is approximately 124 times greater than its proportionality in the background comparison corpus. However, females and males use the word at similar rates (1.06), and so it is not particularly associated with one state or class of this variable. It does not therefore appear that females enrolled in the culture training because they found some aspect of it, its contents, or its outcomes to be more interesting than males found them to be.

Since the same algorithms are used to calculate the subsample comparisons table as are used to calculate the main table, you will find that the same types of patterns emerge. For instance, if one form of a frequently used word is overrepresented in your subsample, then it is likely that the word’s inflections, determiners, and synonyms will also be overrepresented. As previously discussed, the word when grouped with its inflections forms what we call a gist, while synonymous gists together form a concept.
Like the main table, if your stimulus or question is specific and you have acquired a sufficiently sized and representative subsample, you will often be able to identify the essential structure of your natural language pool and find complete phrases, sentences, and revelatory themes formed by reading downward the overrepresented words and concepts in the first column. On the other hand, if the question or stimulus evoking the response is broad, your responses will be comparatively broad, and the connections between gists and concepts will be less readily apparent. In either case, you can use the features in the Advanced menu to identify the relations between the gists and concepts found in your natural language response pool.
Finally, and similar to the main table, if you require even more specificity, you can change your meaning units by subdividing your responses into subsections (such as sentences, paragraphs, or sections), filtering your cases by particular keywords and reanalyzing your data, or asking a more specific question.
More information about understanding and interpreting the results presented in the subsample comparisons table can be found in the Technicals section of this website.
Notes.
1 The text of the question was, "Why are you enrolled in this culture training?"