
Living in Washington State, compared to living in New York State.
This particular survey was designed as a way of educating a general radio audience on how to identify both commonalities and differences in worldviews that may be associated with the places one lives, and the people with whom one interacts. It was conducted by one of our founders, as part of a podcast that he hosts called TheNEWPhenomenologists.
During September 2019, Raven's Eye conducted two separate online polls of Mechanical Turk workers located in either Washington State or New York State, respectively.
We collected brief demographic information, and then asked each of these groups to respond to the following questions in their own words over the course of 2-3 sentences:

What do you most like about living in your part of [participant's state]?

What do you most dislike about living in your part of [participant's state]?
This report presents the panorama and horizon of the worldview derived from the findings. An example of a full worldview may be found here. These findings are the result of an automatic quantitative phenomenology, which was performed on October 12, 2019, by the Raven's Eye team, using our online natural language analysis software1.
On the attitude for this survey.
This survey analysis results from a quantitative phenomenology utilizing Raven's Eye. Our attitude is one that seeks to:
• reliably and validly understand people's thoughts, and
• create model statements that reproduce both the most popular themes in those thoughts, and the ways that participants express them.
What results are plain English statements that express the thoughts of the participants, in the way that they are ordered and structed by the participants themselves.
We acquired similarly sized samples of 86 and 90 Mechanical Turk workers located in Washington State and New York State, respectively.
The main concepts utilized in our model statements were found at rates in excess of 10 times their typical use, and as such provide a measure of confidence in their association with the question posed2, 3. These are emphasized in bold font.
The worldview.

What do you most like about living in your part of [participant's state]?
Washington State.
I love the beautiful scenery.
I like that I am able to access the mountains and the ocean.
I enjoy the mild weather.
I love living in Seattle, and everything there is to do within a short drive away.
New York State.
I like the diversity of people here from different cultures.
I love New York City; there's always something to do.
The city has good food from around the world.

What you you most dislike about living in your part of [participant's state]?
Washington State.
I dislike that there are too many people everywhere.
The traffic is getting worse (I-5 is clogged).
There are a lot of homeless people.
It rains very often.
New York State.
There a lot of people in New York.
It is very expensive to live here.
The cost of living is very high.
The taxes are ridiculous.
The panorama.
Revealing the worldview's panorama involves understanding the general content and form of the natural language data acquired in response to our questions. To do this, we first identify the gists, or individual word forms that are relatively overrepresented in them2. We then consider the overall style of the response set through measures of its vocabulary and verbosity. These gists and this style information then give us a sense of the whole—or as we call it: the panorama—of the worldview.
What do you most like about living in your part of [participant's state]?
-
What do you most like about living in your part of Washington State?
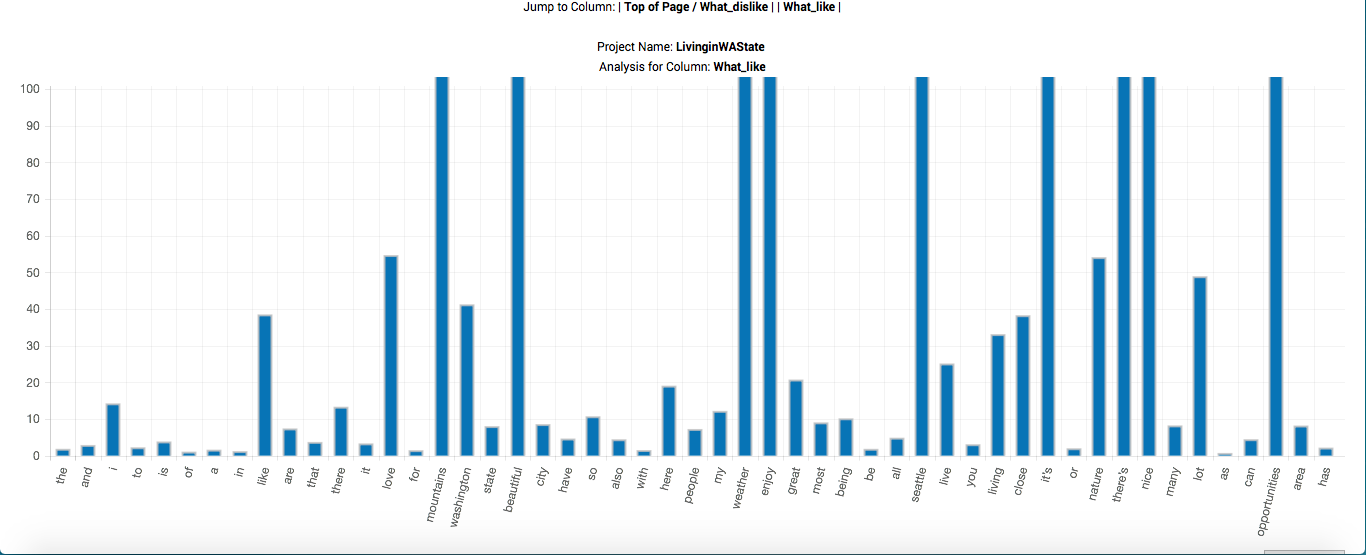
Figure 1. The fifty most frequent words in response to the question: What do you most like about living in your part of Washington State?
The horizontal axis is ranked by word frequency in descending order from left to right. The vertical axis represents the number of times that a word is found to be relatively overrepresented in the response set. The higher the bar, the more important a given word is to the question. Words with bars exceeding the chart height are overrepresented in excess of 100 times their typical use in everyday English.The gists, or main ideas expressed by Mechanical Turk workers in Washington State in response to being asked what they like about living in their part of their state included, among others: mountains, beautiful, weather, and close. The readability and grade-level scores indicate an average vocabulary, while the typical response consists of 15 words over 2-3 sentences.
Measure
Score
Flesch Readability
70.07
Flesch-Kincaid Grade Level
6.79
Average Cell Word Count
15.74
Table 1. Measures of vocabulary and verbosity for responses to the question: What do you most like about living in your part of Washington State?
-
What do you most like about living in your part of New York State?
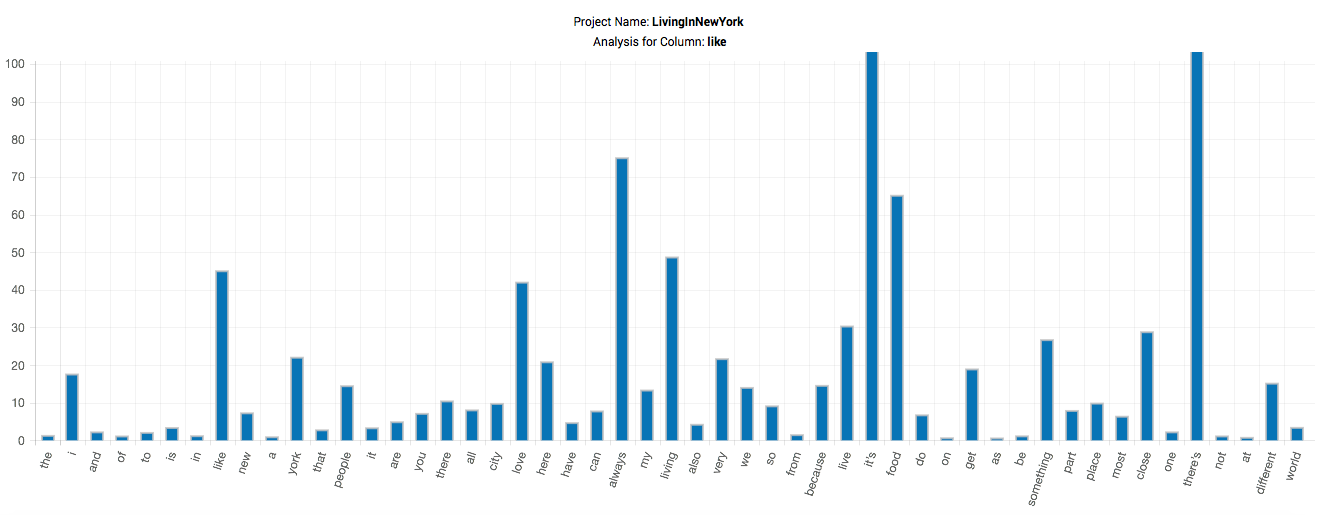
Figure 2. The fifty most frequent words in response to the question: What do you most like about living in your part of New York State?
The horizontal axis is ranked by word frequency in descending order from left to right. The vertical axis represents the number of times that a word is found to be relatively overrepresented in the response set. The higher the bar, the more important a given word is to the question. Words with bars exceeding the chart height are overrepresented in excess of 100 times their typical use in everyday English.The gists, or main ideas expressed by Mechanical Turk workers in New York in response to being asked what they like about living in New York State included: people, city, always, food, and different. The readability and grade-level scores indicate an average vocabulary, while the average response consists of 14 words over 2-3 sentences.
Measure
Score
Flesch Readability
75.17
Flesch-Kincaid Grade Level
5.86
Average Cell Word Count
14.122
Table 2. Measures of vocabulary and verbosity for responses to the question: What do you most like about living in your part of New York State?


Word networks are created, which center on the most frequent and overrepresented concepts. These networks are contracted based on the frequency of actual association in the original dataset. They graphically display the most frequent ordered relations between concepts as they are expressed in the language of our participants. Figures 3 & 4 present three such word networks for highly frequent and overrepresented words used by Washingtonians and New Yorkers respectively, when asked what they like about living in their part of their state.
-
What do you most like about living in your part of Washington State?
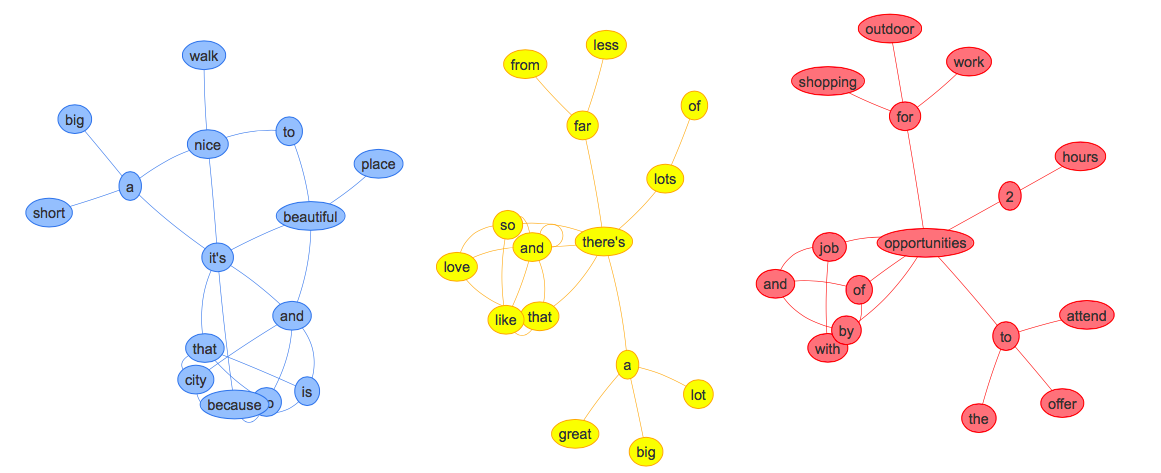
Figure 3. Three overrepresented words and their networks, in response to the question: What do you most like about living in your part of Washington State?
-
What do you most like about living in your part of New York State?

Figure 4. Three overrepresented words and their networks, in response to the question: What do you most like about living in your part of New York State?

What do you most dislike about living in your part of [participant's state]?
-
What do you most dislike about living in your part of Washington State?

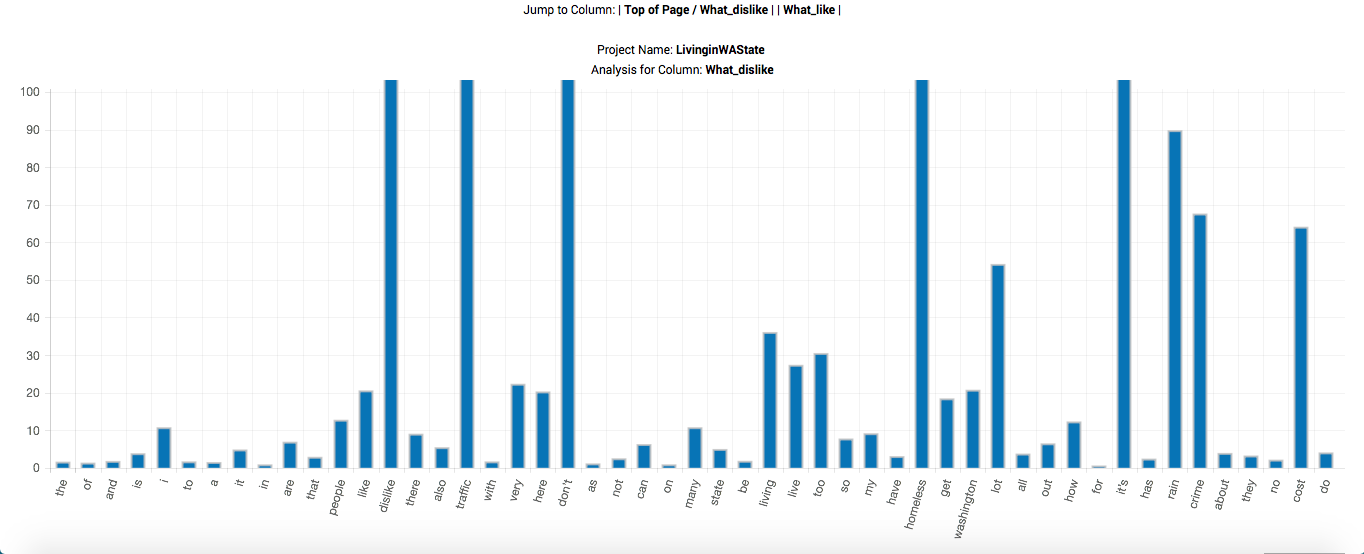
Figure 5. The fifty most frequent words in response to the question: What do you most dislike about living in your part of Washington State?
The horizontal axis is ranked by word frequency in descending order from left to right. The vertical axis represents the number of times that a word is found to be relatively overrepresented in the response set. The higher the bar, the more important a given word is to the question. Words with bars exceeding the chart height are overrepresented in excess of 100 times their typical use in everyday English.The gists, or main ideas expressed by Mechanical Turk workers in Washington State in response to being asked what they dislike about living in their part of their state included: people, traffic, homeless, rain, crime, and cost of living. The readability and grade-level scores indicate an average vocabulary, while the typical response consists of 15 words over 2-3 sentences.
Measure
Score
Flesch Readability
69.44
Flesch-Kincaid Grade Level
6.94
Average Cell Word Count
15.643
Table 3. Measures of vocabulary and verbosity for responses to the question: What do you most dislike about living in your part of Washington State?
-
What do you most dislike about living in your part of New York State?
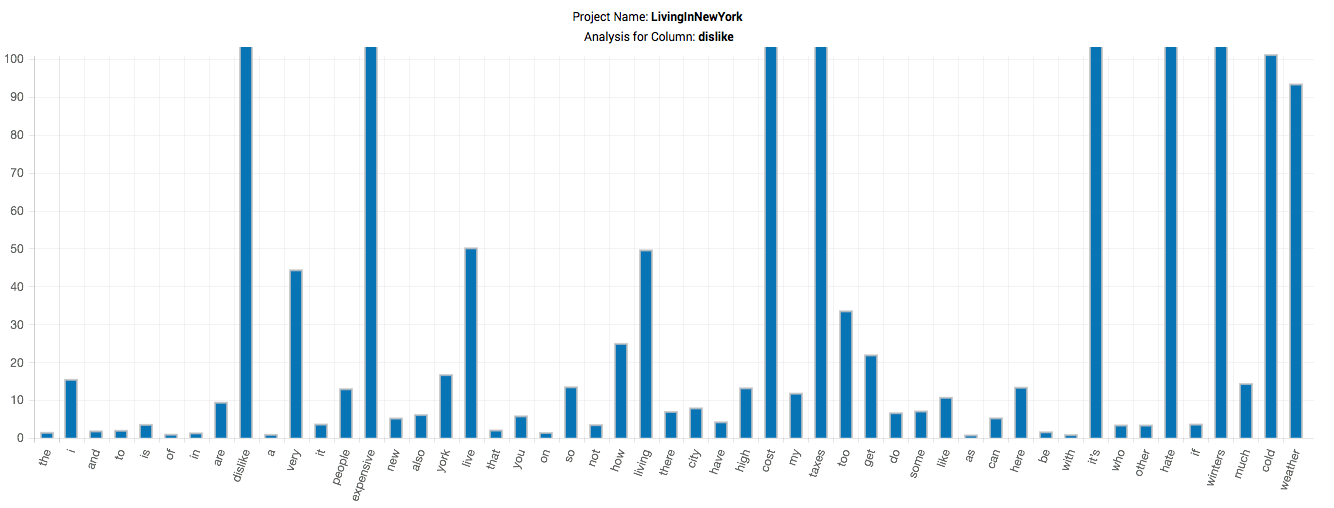
Figure 6. The fifty most frequent words in response to the question: What do you most dislike about living in your part of New York State?
The horizontal axis is ranked by word frequency in descending order from left to right. The vertical axis represents the number of times that a word is found to be relatively overrepresented in the response set. The higher the bar, the more important a given word is to the question. Words with bars exceeding the chart height are overrepresented in excess of 100 times their typical use in everyday English.The gists, or main ideas expressed by Mechanical Turk workers in New York in response to being asked what they dislike about living in New York State included: people, very expensive, high cost of living, taxes, winters, and cold weather. The readability and grade-level scores indicate an average vocabulary, while the average response consists of 12 words over 2-3 sentences.
Measure
Score
Flesch Readability
73.91
Flesch-Kincaid Grade Level
6.01
Average Cell Word Count
12.239
Table 4. Measures of vocabulary and verbosity for responses to the question: What do you most dislike about living in your part of New York State?

Word networks are created, which center on the most frequent and overrepresented concepts. These networks are contracted based on the frequency of actual association in the original dataset. They graphically display the most frequent ordered relations between concepts as they are expressed in the language of our participants. Figures 3 & 4 present three such word networks for highly frequent and overrepresented words used by Washingtonians and New Yorkers respectively, when asked what they like about living in their part of their state.
-
What do you most dislike about living in your part of Washington State?
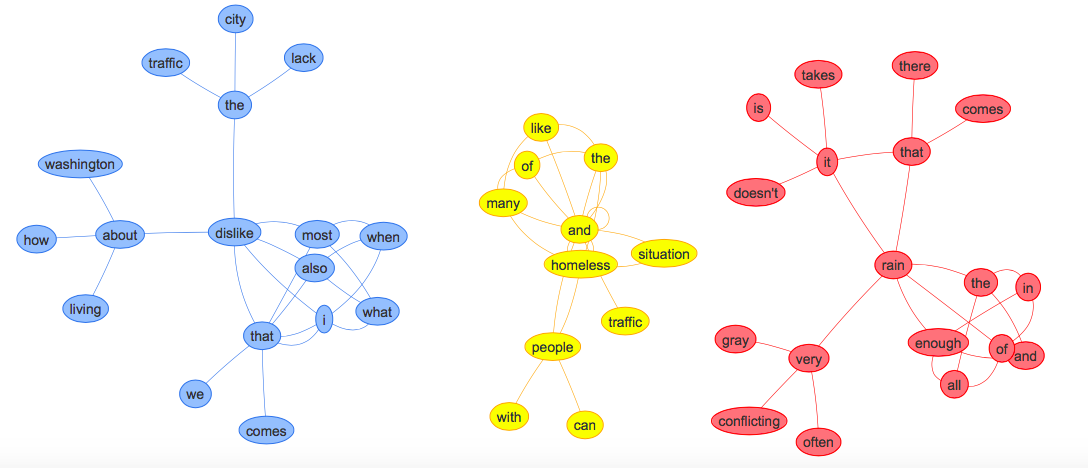
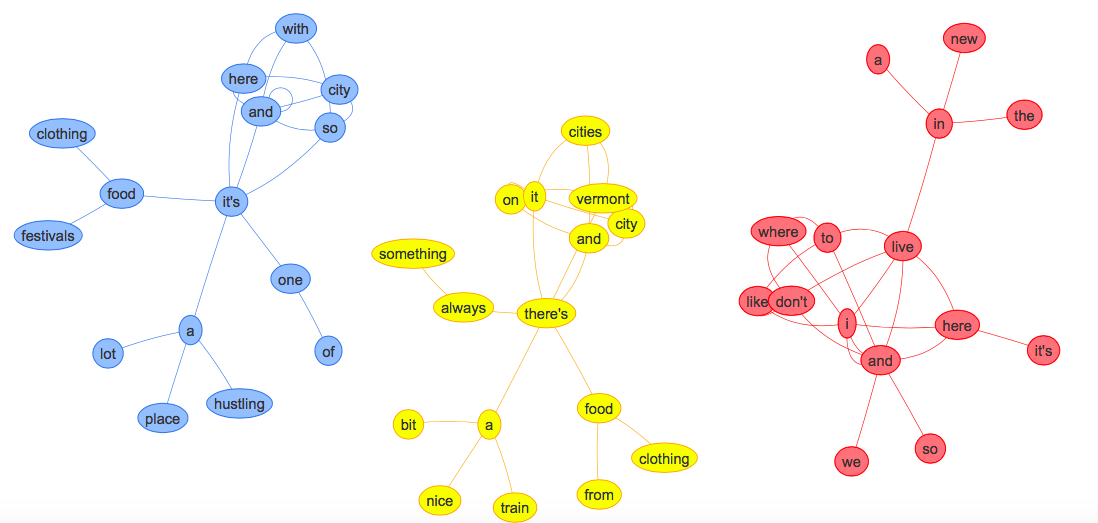
Figure 7. Three overrepresented words and their networks, in response to the question: What do you most dislike about living in your part of Washington State?
-
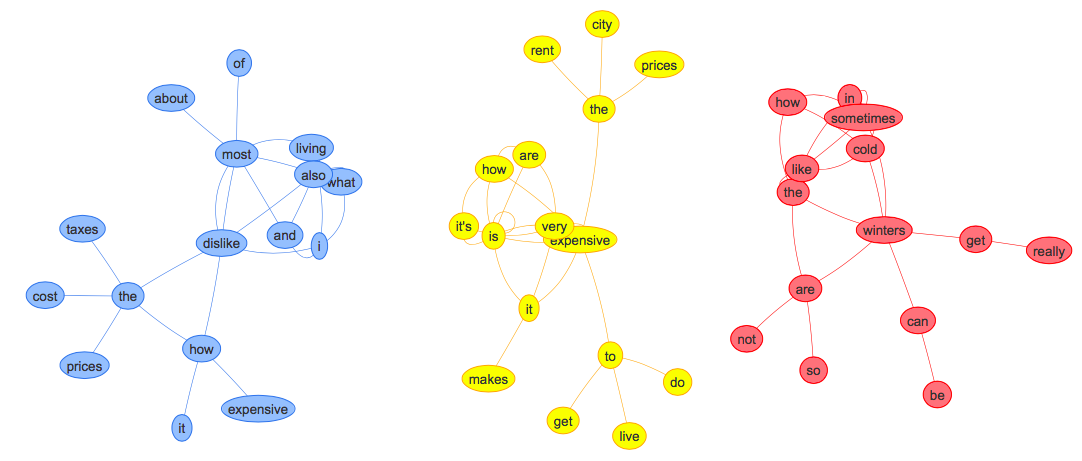
What do you most dislike about living in your part of New York State?

Figure 8. Three overrepresented words and their networks, in response to the question: What do you most dislike about living in your part of New York State?

The horizon.
Our results are bounded by the people, places, and time in which they were produced. For example, our participants were drawn from Amazon Mechanical Turk workers located in the Washington and New York States. As such, they may have certain characteristics or experiences that vary from that expressed by the typical person in these states. These characteristics or experiences may, in turn, systematically relate to variation in thoughts about a given topic between these two groups. The results presented in our study are likewise bounded by the state of history current in the late summer of 2019.
To counter these potential limitations, we have utilized a high threshold for including a concept in our report. In order for a concept to be included in the results of our survey, it must have been expressed at a rate that exceeded 10 times its typical rate of use in everyday English2. By our estimates, our sample likely includes approximately 47% of the total population of Mechanical Turk workers available in Washington State during the time that the survey was available.
The cut-off threshold of 10 that we used for our analysis makes it such that our confidence estimate for our results exceeds the total possible population of Mechanical Turk workers in Washington State. We are, therefore, quite confident that our results can be generally applied to this population, at least at this point in history3.
Notes.
1https://ravens-eye.net Though, since you're already here, you can click on Home in the menu at the top of your browser window to find out more about us.
2To derive our rate of use, we compare the proportionality of a word in the sample to the proportionality of that same word in our 4.8 billion-word corpus of the English language. Based on a nomothetic approach to the lexical hypothesis, the amount to which a word is overrepresented (i.e., found at proportions greater than 1.0) also expresses the degree to which that word is associated with the stimulus (e.g., our open-ended survey questions) by the participants.
3The cut-off threshold that we used for our analysis makes it such that our confidence in the durability of our results exceeds the total population of Mechanical Turk workers in Washington State. Current published Mechanical Turk population estimates indicate that such employment is transient and fluid, resulting in an average likelihood of 182 total Mechanical Turk workers being available in Washington State during a given week. Maximum estimates would put the total available workers in Washington State at 455.
An overrepresentation score of 10 means that a given word is found in response to the question at 10 times its rate in the 4.8 billion-word background corpus of everyday English. Setting the overrepresentation cut-off score at 10 then, means that we do not include words with overrepresentation scores below this score. All else being equal, in order for a given word to be mistakenly overrepresented, we would need to acquire 9 times our current pool of respondents (86 and 90 respectively) who never once use the word again.
For Washington State, this would mean acquiring 774 more respondents (86 x 9 = 774 + 86 = 860, or 10 times the original pool of 86 respondents), each of whom would have to refrain from ever mentioning the word again. Given the population estimates for Mechanical Turk workers, this additional pool would be 1.7 times the maximum population estimate, and 3.9 times the likely population estimate of the total number of workers in Washington State. Therefore, the estimate of confidence greatly exceeds the possibility that the word was mistakenly overrepresented.