Thankfulness in the United States, 2019.
During November 2019, Raven's Eye conducted its third nationwide survey on thankfulness. We asked participants from the United States of America to provide their age, gender, and state of residence, and then asked them to respond to two open-ended questions about their thoughts:

For what or whom are you most thankful, and why?

At this time, what or whom do you need most, and why?
In two separate questions we then asked them to rate, on a scale of 1-7, with one being equal to "only this once" and seven being equal to "all the time," how often they felt thankful for the person or thing they described in the first open-ended question, and how often they became aware of the need they described in the second open-ended question.
This report presents a worldview derived from the findings of this year's survey. These findings are the result of an automatic quantitative phenomenology, which was performed on December 1, 2019, by the Raven's Eye team, using our online natural language analysis software1.
While you're here, feel free to contribute your thoughts to our ongoing survey on thankfulness in the United States.
The worldview.
This report consists of an automatic quantitative phenomenology of a nationwide survey on thankfulness in the United States, which was performed on December 1, 2019 by Raven's Eye. The report is based on a survey conducted at the end of November, 2019 utilizing responses from 795 people via Amazon's Mechanical Turk. The main concepts utilized in our model statements were found at rates in excess of 15 times their typical use, and as such provide a measure of confidence in their association with the question posed2. These are emphasized in bold font.

For what or whom are you most thankful, and why?
I am most thankful for my family because they love me, and have always been there for me.
I am thankful for friends in my life, who love and support me.
I am grateful for my good health.
I am thankful for god.
I'm thankful for everything that I have been able to do.

At this time, what or whom do you need most, and why?
At this time, I most need my family.
At this time in my life, I need more money.
I most need love and support.
What I need most right now is a job.
Influential viewpoints.
Worldviews are determined by the people, places, and times that co-create them. Therefore, in order to more fully understand the worldview on thankfulness and need presented in this survey, we highlight those aspects that contextualize and influence our findings. We do so according to their origin in human factors (kuturgeist), spatial or environmental factors (ortgeist), or time-based factors (zeitgeist).
Kulturgeist
Our participants were recruited from Amazon Mechanical Turk, and were paid $0.20 for completing our 4-question survey. A total of 807 responses were received. After eliminating non-compliant responses, 795 were deemed eligible for inclusion.
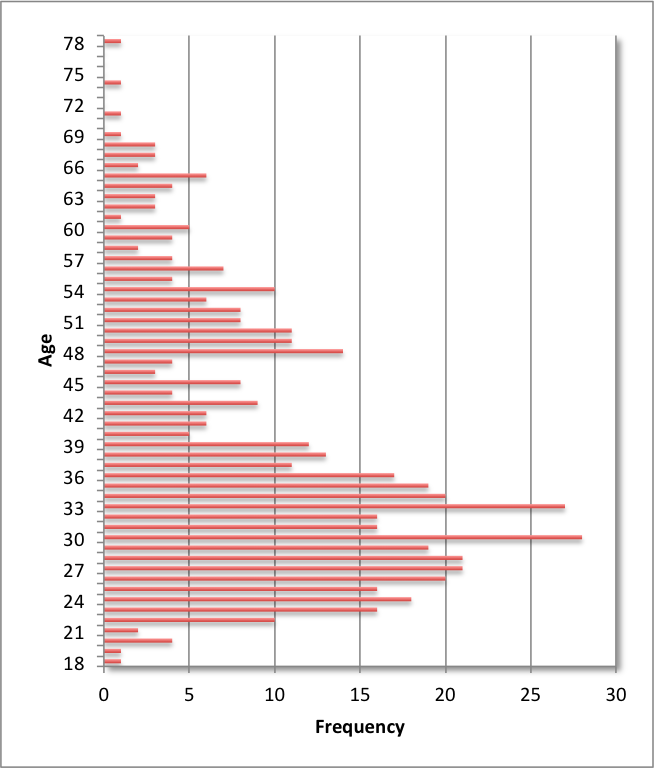
As is depicted in Figure 1, our respondents were all adults, with an average age of 38.7 years old and a median age of 35 years old. Females were proportionally more represented then males, as is depicted in Figure 2.
Ortgeist
The participants who took part in our study did so online through Amazon's Mechanical Turk. We limited our solicitation to those who were located in the United States of America, and requested that participants select the State in which they reside. We grouped reported States according to US Census Regions, and compared this to 2018 US Census population estimates. Doing so indicates that our sample is regionally representative.
Zeitgeist
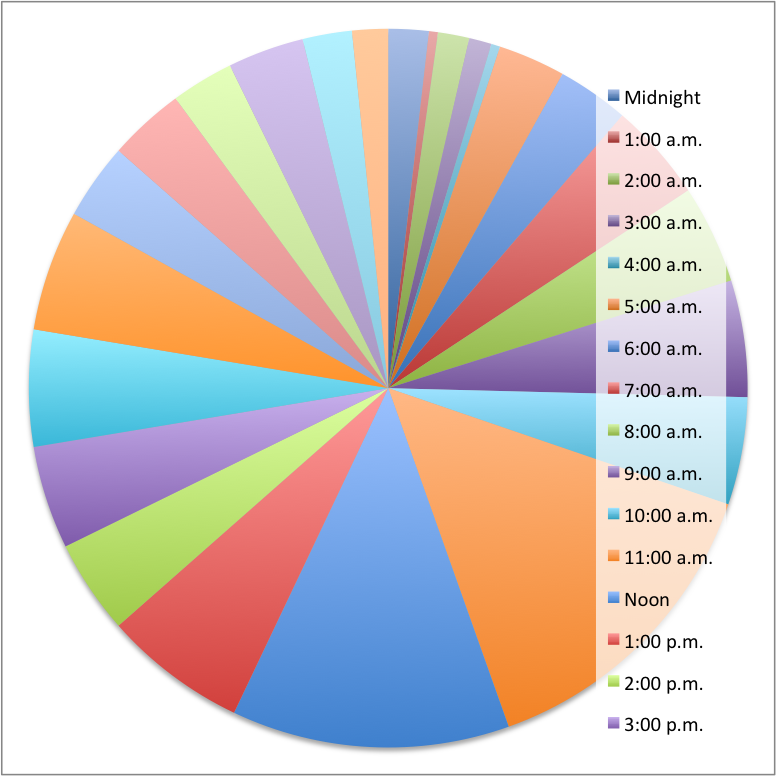
This survey began on November 26, 2019 at 11:14 p.m., PST and was continuously available until its conclusion on November 28th, 2019 at 1:08 p.m PST. Figure 3 reveals the distribution of completed surveys during the 38-hour period.
-

Figure 1. A frequency distribution of our participants' reported ages.
-
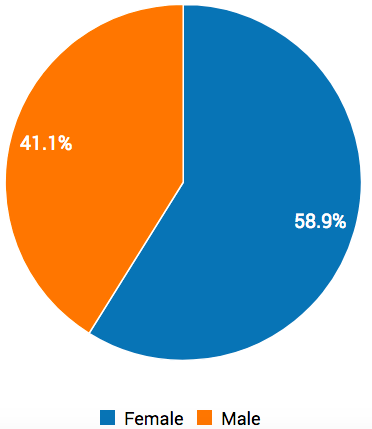
Figure 2. The proportion of responses received by females and males.
-

Figure 3. A clockwise distribution of responses, according to the time of day that they were received.


The panorama.
Revealing the worldview's panorama involves understanding the general content and form of the natural language data acquired in response to our questions. To do this, we first identify the gists, or individual word forms that are relatively overrepresented in them2. We then consider the vocabulary and verbosity of the response set, in order help to further the general understanding the form of voice taken by our participants.
-
For what or whom are you most thankful, and why?

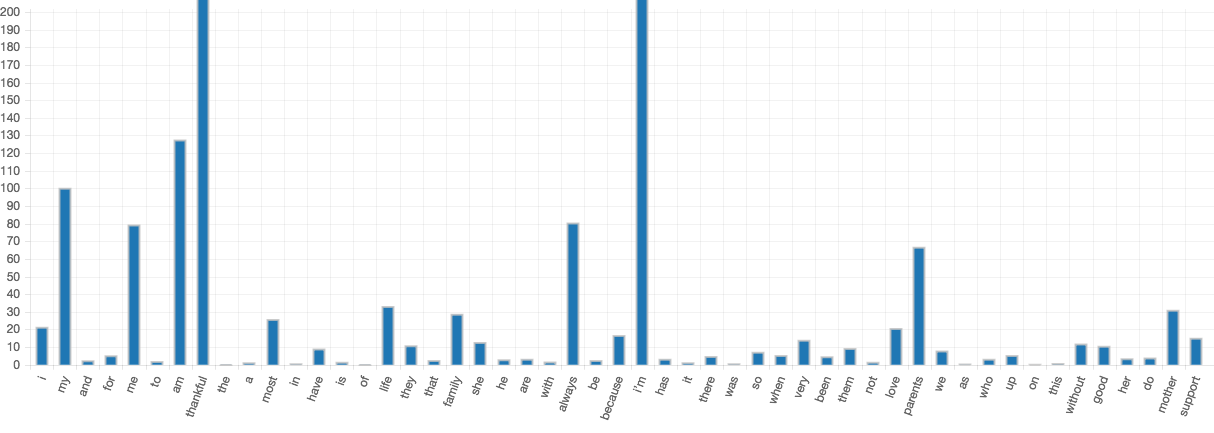
Figure 4. The fifty most frequent words in response to the question: For what or whom are you most thankful, and why? The vertical axis represents the number of times that a word is found to be relatively overrepresented in the response set.
As visualized in Figure 4, in addition to words related to the question (such as I and thankful), concepts such as life, family, always, love, and support are central to the experience of thankfulness in our respondents. Family in general is cited as something for which our participants are thankful, as are specific family members. The readability and grade-level scores indicate an average to low-average vocabulary, while the average response consists of 16 words over 2-3 sentences.
Measure
Score
Flesch Readability
79.03
Flesch-Kincaid Grade Level
5.59
Average Cell Word Count
16.58
Table 1. Measures of vocabulary and verbosity for responses to the question: For what or whom are you most thankful, and why?
-
At this time, what or whom do you need most, and why?

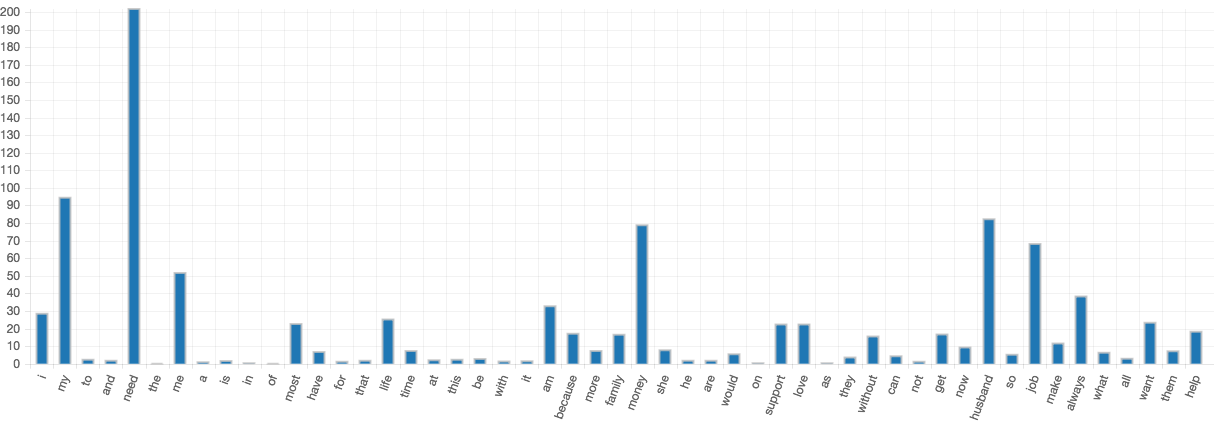
Figure 5. The fifty most frequent words in response to the question: At this time, what or whom do you need most, and why? The vertical axis represents the number of times that a word is found to be relatively overrepresented in the response set.
Just as in the previous question, words related to the stimulus (such as I and need) are relatively overrepresented in response to the question on need. Figure 5 illustrates the overrepresentation of these and other concepts, such as life, family, money, support, love, and job are central to the experience of need in our respondents. As with the first question, family in general is cited as something our participants need, as are specific family members. The readability and grade-level scores indicate an average to low-average vocabulary, while the average response consists of 14 words over 2-3 sentences.
Measure
Score
Flesch Readability
81.79
Flesch-Kincaid Grade Level
5.15
Average Cell Word Count
13.74
Table 2. Measures of vocabulary and verbosity for responses to the question: At this time, what or whom do you need most, and why?

Its parts.
As we note when surveying the panorama, we asked two demographic questions and two open-ended questions of our participants. We now consider our open-ended questions independently, because they denote natural partitions in our natural language dataset.

For what or whom are you most thankful, and why?
Our participants identified a number of people, experiences, opportunities, and things for which they were thankful. Word networks for the three most frequent and overrepresented concepts in the responses are depicted in Figures 6-8. These networks graphically display the most frequent ordered relations between concepts as they are expressed in the language of our participants.
Figure 9 displays example responses from our participants, which we call direct expressions. Such expressions are real-use cases selected from the pool of responses to the question because they contain several overrepresented concepts within them. As such, they demonstrate the relationships between concepts as they are actually used by our participants.
Model revelatory statements represent popular means of connecting the most frequent and overrepresented concepts in the responses. They are synthetically constructed by replicating the frequency of ordered relationships between words as they are actually expressed in the response set. As a result, they emulate the voice of the participants themselves.
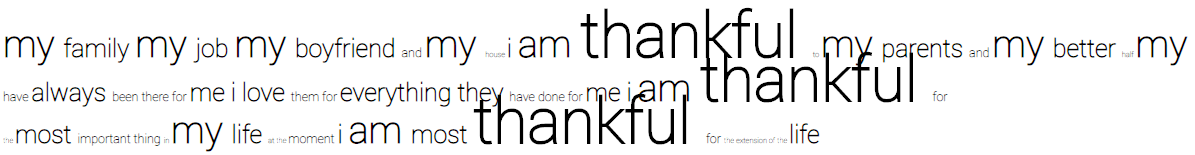
Figure 9. Direct expressions drawn from the meaning unit: For what or whom are you most thankful, and why? These expressions contain real-use associations between overrepresented concepts. Font size indicates the relative overrepresentation of a give concepts, as compared to the other concepts in the expressions.
-

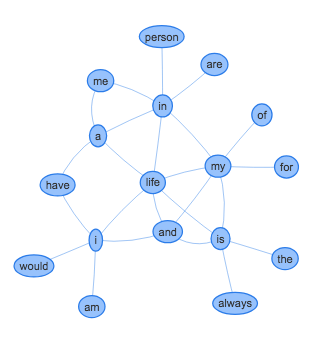
Figure 6. Popular associations with the word life, as determined by the order, sequence, and frequency of word relations in the response set.
-

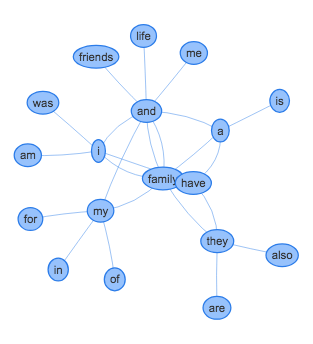
Figure 7. Popular associations with the concept family, as determined by the order, sequence, and frequency of word relations in the response set.
-
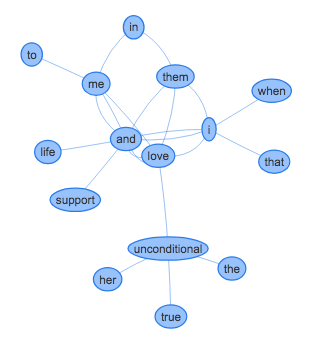
Figure 8. Popular associations with the concept love, as determined by the order, sequence, and frequency of word relations in the response set.


Model revelatory statements:
I am most thankful for my family because they love me, and have always been there for me.
I am thankful for friends in my life, who love and support me.
I am grateful for my good health.
I am thankful for god.
I'm thankful for everything that I have been able to do.

At this time, what or whom do you need most, and why?
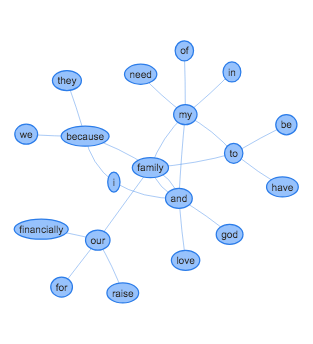
Our participants identified a variety of people and things that they needed at this point in their lives. As with the previous question, the word networks for the three most frequent and overrepresented concepts in the responses are depicted in Figures 10-12. These networks graphically display the most frequent ordered relations between concepts as they are expressed in the language of our participants.
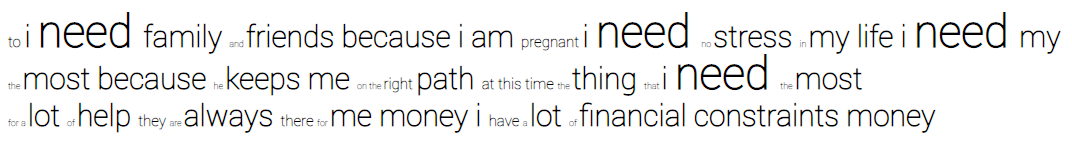
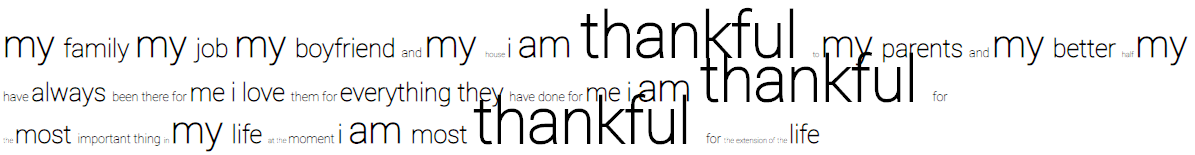
Figure 13 displays example responses from our participants, which we call direct expressions. Such expressions are real-use cases selected from the pool of responses to the question because they contain several overrepresented concepts within them. As such, they demonstrate the relationships between concepts as they are actually used by our participants.
Model revelatory statements represent popular means of connecting the most frequent and overrepresented concepts in the responses. They are synthetically constructed by replicating the frequency of ordered relationships between words as they are actually expressed in the response set. As a result, they emulate the voice of the participants themselves.

Figure 13. Direct expressions drawn from the meaning unit: For what or whom are you most thankful, and why? These expressions contain real-use associations between overrepresented concepts. Font size indicates the relative overrepresentation of a give concepts, as compared to the other concepts in the expressions.

-

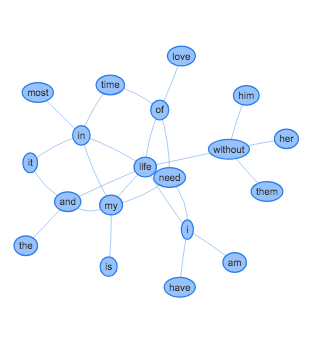
Figure 10. Popular associations with the concept life, as determined by the order, sequence, and frequency of word relations in the response set.
-

Figure 11. Popular associations with the concept family, as determined by the order, sequence, and frequency of word relations in the response set.
-
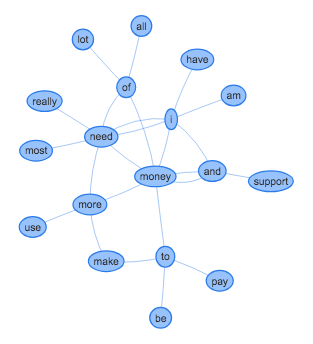
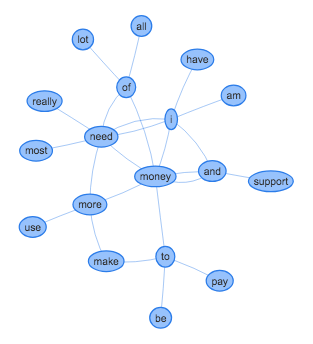
Figure 12. Popular associations with the concept money, as determined by the order, sequence, and frequency of word relations in the response set.

Model revelatory statements:
At this time, I most need my family.
At this time in my life, I need more money.
I most need love and support.
What I need most right now is a job.
Its structure.
The structure of the worldview is identifiable by examining how its viewpoints influence the concepts, themes, and statements identified in response to our questions. To do so, we inspect for variation in the proportional representation of words and their relationships between specific states or classes of human, environmental, and time-based factors.
Kulturgeist
As depicted in Figures 15 and 16, the self-identified sex of the respondent appeared to result in some variation in thematic content. This variation specifically pertained to the use of the terms husband and wife. In both questions, females used the word husband at much greater rates than did males. Males, in turn, used the word wife in response to both questions at much greater rates than did females.
A pattern of difference between males and females therefore exists, in which variation in sex is structurally related to variation in both thankfulness and need. This structural relation pertains specifically to marital relationships. The most frequent modifier used by males to refer to wives is loving, as in my loving wife. The most frequent modifier used by females to refer to husbands is wonderful, as in my wonderful husband.
-

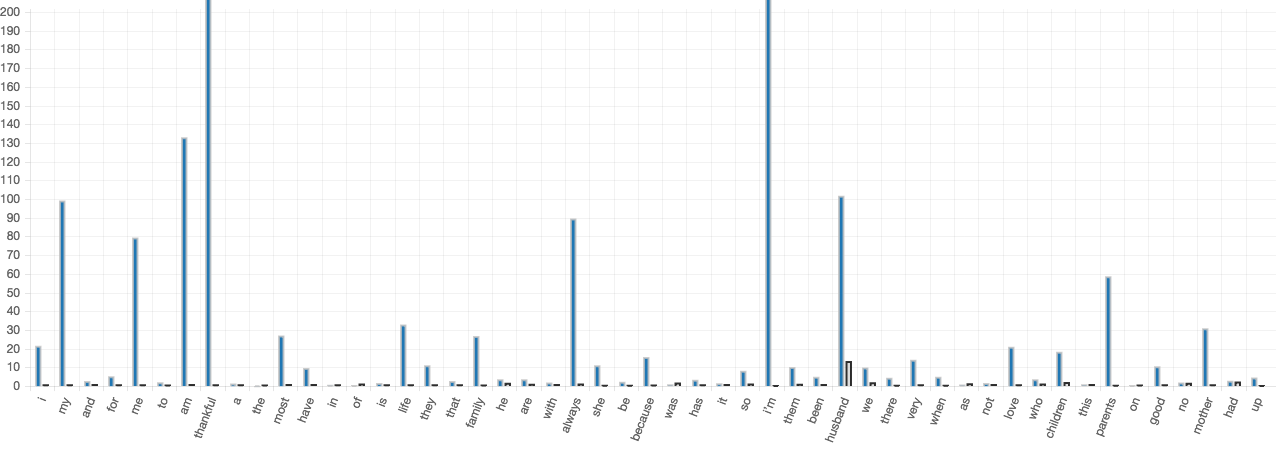
Figure 15a. The 50 most frequent words in the responses from females to our question on thankfulness, as compared to responses to the same question from males. Husband is mentioned 13 times more often by females than it is by males.
-

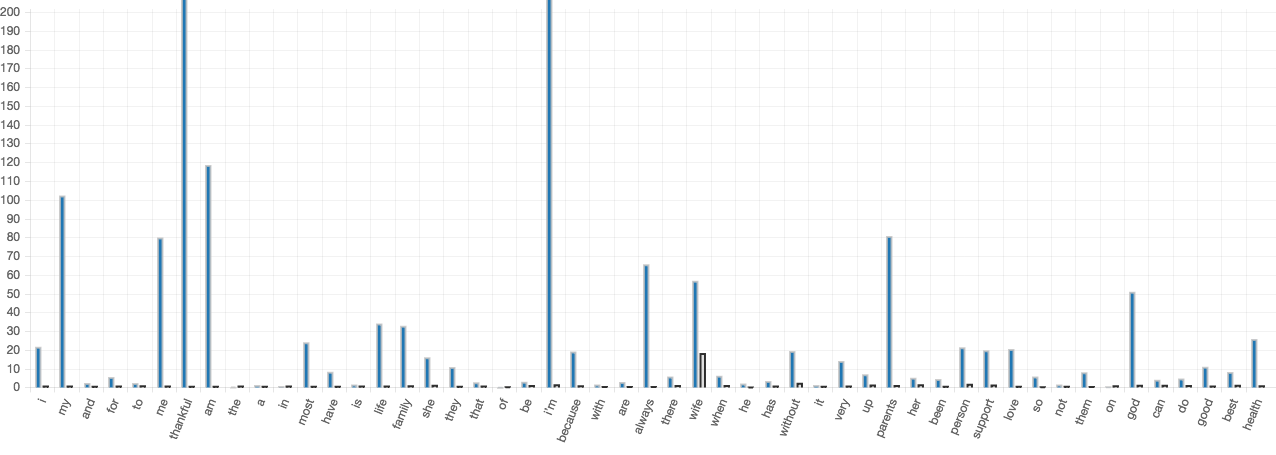
Figure 15b. The 50 most frequent words in the responses from males to our question on thankfulness, as compared to responses to the same question from females. Wife is mentioned 18 times more often by males than it is by females.
-

Figure 16a. The 50 most frequent words in the responses from females to our question on need, as compared to responses to the same question from males. Husband is mentioned 13 times more often by females than it is by males.
-

Figure 16b. The 50 most frequent words in the responses from males to our question on need, as compared to responses to the same question from females. Wife is mentioned 18 times more often by males than it is by females.


Ortgeist
As noted previously, participation in the online Mechanical Turk environment, and location in the United States were inclusionary criteria for participation. These environmental factors influence the result globally by determining the horizon within which the results can be applied. Variation within them (such as degree of privacy and location within the United States) is likely present, but not systematically measured in this current project.
Zeitgeist
The present study was conducted over the course of 55 hours between October 20th and October 22nd, 2018. We inspected hour of day for variation in themes. While some variation was identified, none reached sufficient overrepresentation to warrant further investigation in the current study.
The horizon.
Our results are bounded by the people, places, and time in which they were produced. For example, our participants were drawn from Amazon Turk workers located in the United States. As such, they may have certain characteristics or experiences that vary from that expressed by the typical person in the United States. These characteristics or experiences may, in turn, systematically relate to variation in thoughts about a given topic between these two groups. The results presented in our study are likewise bounded by the state of affairs current in the United States during the fall of 2018.
To counter these potential limitations, we have utilized a high threshold for including a concept in our report. In order for a concept to be included in the results of our survey, it must have been expressed at a rate that exceeded 15 times its typical rate of use in everyday English2. We believe, therefore, that our results provide valid and reliable indicators of thankfulness and need in peoples, places, and times similar to those found in our survey.
We are engaged in the ongoing study of thankfulness and need, in order to identify enduring patterns. We conducted a nation-wide survey in the fall of 2017, which utilized the same questions and acquired participants in the same manner. We plan to again conduct our research in the fall of 2019, in order to identify potential large-scale trends in time.
Notes.
1https://ravens-eye.net
2To derive our rate of use, we compare the proportionality of a word in the sample to the proportionality of that same word in our 4.8 billion-word corpus of the English language. Based on a nomothetic approach to the lexical hypothesis, the amount to which a word is overrepresented (i.e., found at proportions greater than 1) also expresses the degree to which that word is associated with the stimulus (e.g., our open-ended survey questions) by the participants. We only included words that were in found at proportions exceeding 15 times their proportionality in the background comparison corpus. This means that—all else being equal—in order for our concepts to return to the rate that they are typically used in the English language (and therefore not be particularly associated with our questions) we would need to acquire responses from an additional 6,944 people (14 x 496 = 6,944), all of whom must avoid saying the terms noted in our report. Given the trends expressed in the current sample, however, statistical sampling theory would indicate that such an event is highly unlikely. Therefore, we can be highly confident in the validity and reliability of the concepts and statements identified in this report.
husband
children
wife